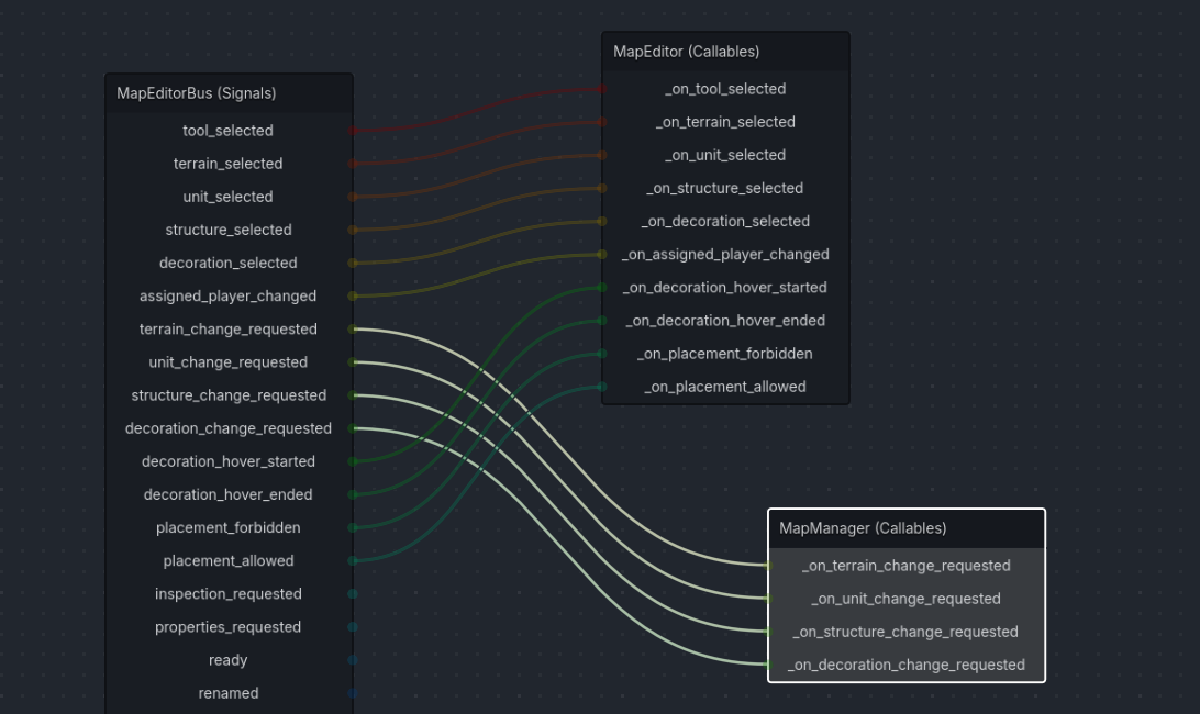
A Visual Debugger for Godot’s Signals
My Role#
Creator and Maintainer
Technical Details#
- Free and open-source
- Available in the Godot Asset Library and Github
- 1.0 release in January 2025
Development Notes#
One of the features of Godot that I have always really appreciated is the top-down support in the engine for signals, which are a built-in implementation of what you would call events in C#, for exampe.
However, as a project gets bigger in the engine, it becomes pretty cumbersome to keep track of all the signals at any point in a game’s runtime. I faced this problem during a project for a client with Studio Bravarda and decided to take this opportunity to explore the plugin architecture of Godot and try to create a solution that would work for me and the community.
I was extremely impressed by it and was able to get a plugin working from scratch in two days that did what I wanted: allowing me to see all the signals of a node visually in graph form.
I decided to release the plugin as a FOSS project, and the reception has been amazing. I hope to keep maintaining it and help it grow alongside Godot. Hopefully, I, alongside contributors, can turn it into the go-to debugger for signals in the Godot ecosystem.
Features#
- Click on a node in the remote scene tree and instantly view all its signals’ connections
- View signal emissions in real-time as they are emitted in-game
- Select and rearrange a graph view to inspect your signal connections
- Freeze signal emissions so you can inspect them later
- Modify the signal emission speed so you can fine-tune the experience for your debugging purposes
- Supports inspection of built-in and custom signals
- Supports inspection of built-in nodes, custom nodes and autoloads — if - it’s in the remote tree, you can inspect it.
Extras#
I released a video in my youtube channel (in portuguese) detailing the process of making the plugin and sharing some lessons learned:
